The A/B Test Whisperer: How to Interpret Your Conversion Rate Data

Why A/B Testing Conversion Rate Is the Key to Opening Hidden Revenue
A/B testing conversion rate is the process of comparing two versions of a webpage or element to determine which drives more conversions, measured as a percentage of total visitors who complete a desired action. Here’s what you need to know:
- Calculate conversion rate: (Conversions / Total Visitors) * 100
- Statistical significance matters: Run tests for at least 2 weeks to ensure results aren’t due to random chance
- Focus on impact: Even a 1% lift in conversion rate can dramatically increase revenue without spending more on traffic
- Test one element at a time: Isolate changes (headline, CTA, form length) to understand what actually drives results
- Benchmark: 2-5% is considered a good conversion rate, but improvement over your baseline is what counts
Most businesses pour money into driving more traffic to their websites while ignoring the conversion rate sitting right in front of them. You already paid to get visitors to your site–shouldn’t you maximize what happens when they arrive? The hard truth is that without A/B testing, you’re making decisions based on gut instinct rather than data, and that’s expensive.
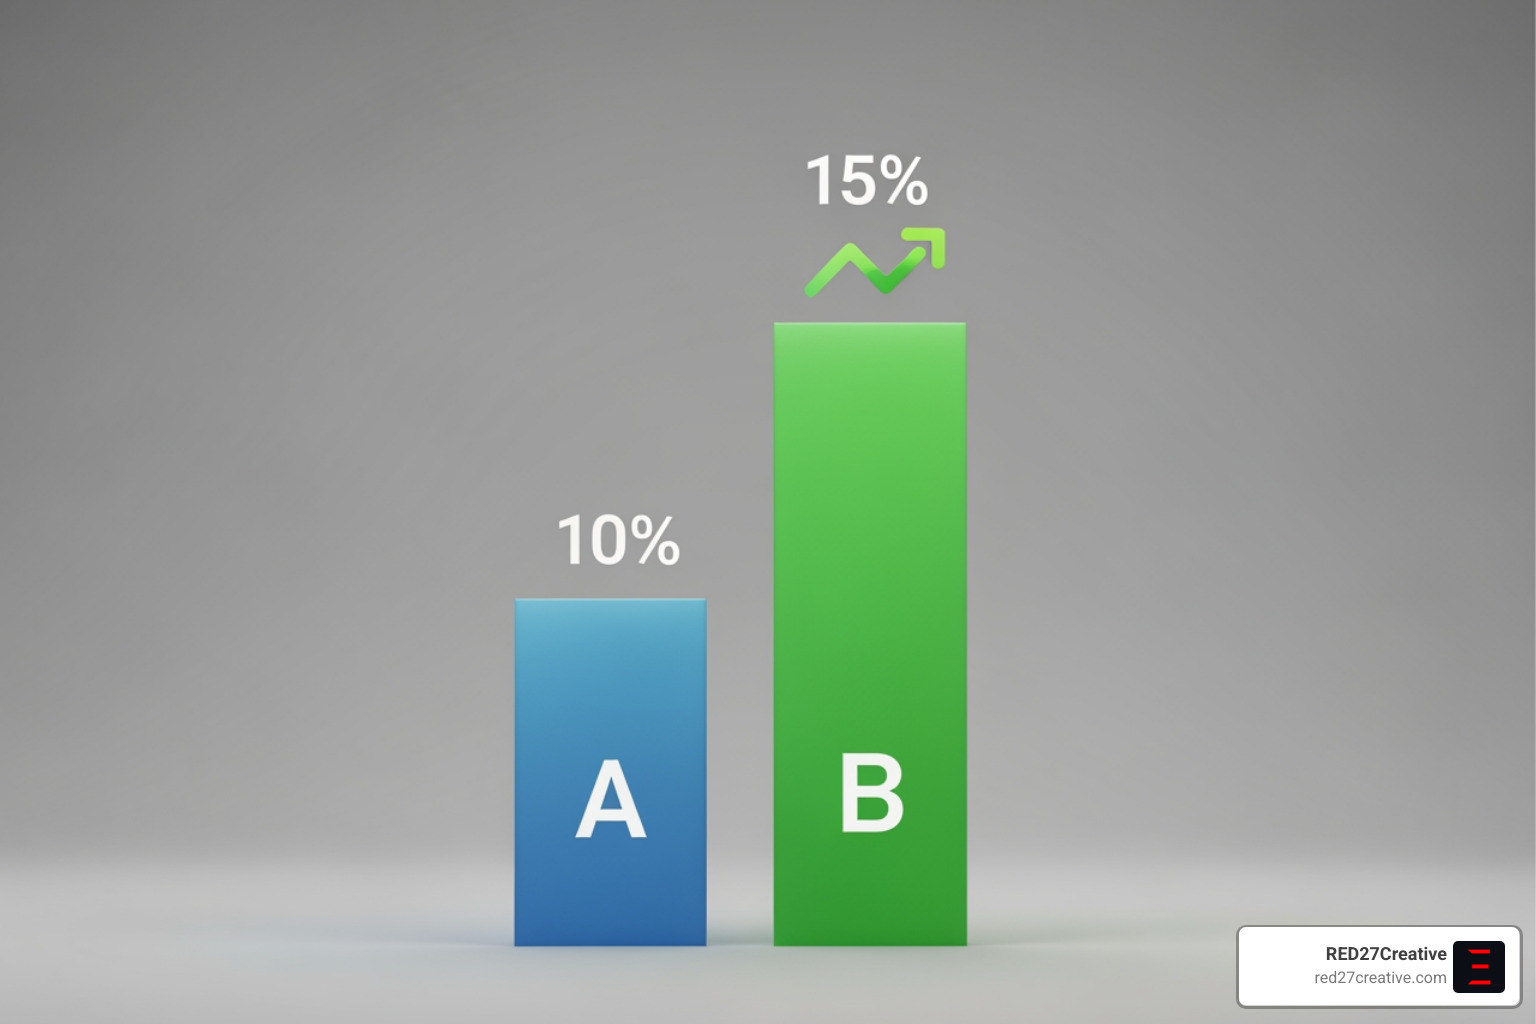
A/B testing isn’t complicated, but it is scientific. You split your audience between two versions of a page, measure which performs better against a specific goal, and then implement the winner. When done correctly, it removes guesswork and replaces it with measurable, repeatable growth.
According to industry data, only one in eight A/B tests yields significant results, which is exactly why a structured approach matters. You can’t just change button colors and hope for the best–you need a hypothesis, proper test duration, and statistical validation.
The benefits extend far beyond just “more conversions.” By optimizing conversion rates, businesses can increase revenue from existing traffic, lower customer acquisition costs, and gain deeper insights into what their customers actually want. Companies investing in conversion rate optimization report an average ROI of 223%, and 90% rate their CRO programs as valuable or extremely valuable for achieving strategic goals.
But here’s where most people get stuck: interpreting the results. You run the test, the tool spits out a bunch of numbers–p-values, confidence intervals, statistical significance–and you’re left wondering, “Did this actually work, or not?”
That’s the gap this guide is designed to close. We’re going to walk through the entire process, from forming a testable hypothesis to analyzing your data like a pro, so you can make confident, data-backed decisions that drive real business growth.
I’m Kiel Tredrea, founder of RED27Creative, and over the past 20 years I’ve helped hundreds of businesses improve their A/B testing conversion rate through structured, data-driven strategies that turn traffic into measurable revenue. My team and I specialize in building marketing systems where every component–SEO, website design, and lead generation–works together to create predictable, scalable growth.
The Foundations: What is A/B Testing and Why It’s Your CRO Superpower
At its heart, A/B testing is a controlled experiment. We compare two versions of something–let’s call them Version A (your current “control”) and Version B (your proposed “variation”)–to see which performs better against a specific goal. This scientific method allows us to make data-driven decisions about everything from website design to marketing copy and is a fundamental technique for Conversion Rate Optimization (CRO).
Why is this so important for CRO? Simply put, A/B testing removes the guesswork. Instead of relying on opinions or what a competitor is doing, we use real user data to understand what resonates with our audience.
This methodical approach directly impacts the bottom line by increasing revenue from existing traffic and lowering customer acquisition costs. It’s a core part of building The Competitive Edge of Data-Driven Marketing.
How to Calculate Conversion Rate and Define ‘Good’
Before we dive into the “how,” let’s clarify the “what.” Your conversion rate is a simple yet powerful metric: it’s the percentage of visitors who complete a desired action on your website.
To calculate it, we use this straightforward formula:
Conversion Rate = (Conversions / Total Visitors) * 100
What counts as a “conversion” depends entirely on your business goals. For an e-commerce site, it might be a purchase, while for a service-based business, it could be a form submission or a phone call. For a content site, it might be a newsletter signup or a download, so we define these Key Performance Indicators (KPIs) upfront to ensure we’re measuring what truly matters.
So, what constitutes a “good” conversion rate? This is where things get a little nuanced. While a general benchmark of 2-5% is often cited as a good conversion rate across industries, it can vary significantly.
For instance, some niche B2B industries might have lower rates, while highly targeted landing pages might see much higher numbers. The most important thing isn’t just hitting a benchmark, but rather improving upon your own baseline.
Even a minor jump in conversions, say from 2% to 2.5%, can have a significant impact on your overall revenue. We help businesses in Geneva, Batavia, Aurora, St. Charles, Plainfield, Oswego, Naperville, and Chicago define and achieve their conversion goals through More info about our Marketing Strategy services.
A/B Testing vs. Multivariate Testing
When it comes to experimentation, A/B testing often gets confused with its more complex cousin: multivariate testing. While both are powerful CRO tools, they serve different purposes and have different requirements.
Here’s a quick comparison:
| Feature | A/B Testing | Multivariate Testing (MVT) |
|---|---|---|
| Variables Tested | One element at a time (e.g., headline, CTA color) | Multiple elements simultaneously (e.g., headline, image, CTA color) |
| Goal | Determine which single change performs best | Identify optimal combination of multiple changes and their interactions |
| Traffic Needed | Less traffic required | Significantly more traffic required |
| Test Duration | Faster to reach significance | Longer duration to reach significance |
| Complexity | Simpler setup and analysis | More complex setup and statistical analysis |
| Use Case | Incremental improvements, clear impact of one change | Major page redesigns, understanding element interactions |
A/B testing is ideal for focused, incremental improvements. By changing one element at a time, it’s quicker to yield results and requires less website traffic to achieve statistical significance.
Multivariate testing (MVT), on the other hand, tests multiple variations of multiple elements simultaneously to find the best combination and understand how they interact. However, MVT demands a substantially larger audience and longer test durations to be statistically valid, making it often unfeasible for businesses with less than 50,000 monthly pageviews.
The 5-Step Process for A/B Testing Conversion Rate
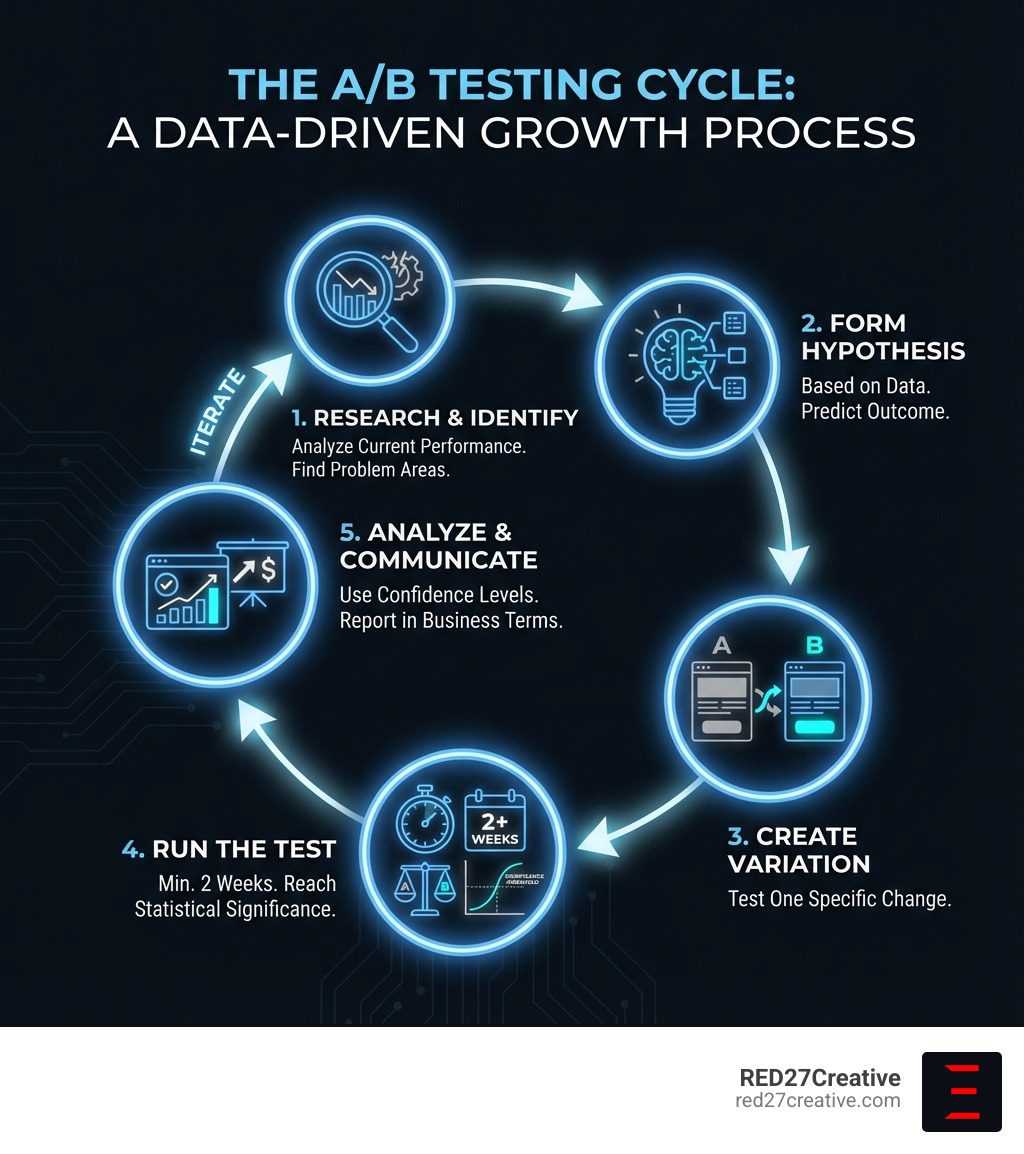
Running an effective A/B test is a structured, 5-step process that ensures data-driven, actionable results and iterative improvement.
This systematic approach helps us move from identifying a potential problem to implementing a validated solution, turning insights into real business growth.
Step 1 & 2: Research and Form a Strong Hypothesis
Successful A/B tests start with research, not guesswork. We use a combination of quantitative and qualitative data to identify genuine problem areas.
Quantitative data from tools like Google Analytics shows us what is happening by revealing patterns in user drop-offs, bounce rates, and clicks. To understand why it’s happening, we turn to qualitative data from user surveys and feedback tools, which reveal user frustrations and motivations. This combination helps us pinpoint areas ripe for improvement.
Once we understand the problem, we formulate a strong hypothesis: a testable statement that predicts the outcome and explains why we expect it. We use a framework like: “Because we saw [data/feedback], we expect that [change] will cause [impact].” For example: “Because data shows a high bounce rate on our product page, we expect that adding customer testimonials will increase user trust and lead to more add-to-cart actions.”
We prioritize hypotheses using models like ICE (Impact, Confidence, Ease) or PIE (Potential, Importance, Ease) to focus our efforts on tests most likely to yield significant results with manageable effort. For further guidance, check out A guide to creating testable hypotheses.
Step 3 & 4: Create Your Variation and Run the Test
With a clear hypothesis, it’s time to build the “B” version. The golden rule is to isolate one change per A/B test to know exactly which element caused the performance difference. We change only one variable, like a headline or CTA button color.
We use specialized A/B testing tools like VWO and Optimizely to create variations, split traffic, and collect data. Before launching, we use online calculators to determine the required sample size based on the current conversion rate, the minimum detectable effect, and desired statistical significance.
We then run the test for a minimum of two weeks to account for fluctuations in user behavior. It’s also crucial to be mindful of external factors, such as holidays or marketing campaigns, that could pollute the data. Clean data is paramount for making effective decisions that impact our ability to Generate Traffic to Your Website.
Step 5: Analyze Results and Communicate Findings
Once the test is complete, we analyze the results to determine if the observed difference is statistically significant—meaning it’s a real difference, not just random chance. We look at the confidence level (typically 90-95%) and the p-value. A low p-value (e.g., less than 0.05) indicates the result is statistically significant, meaning our variation genuinely performed differently.
The key is to translate this statistical jargon into clear, actionable business insights, focusing on the impact on revenue, leads, or user engagement. Instead of just stating a p-value, we communicate the relative improvement percentage and uncertainty intervals. For example: “The new CTA button resulted in a 3% increase in conversions, and we’re 95% confident that the true improvement lies between 0.6% and 4.8%.” This provides a clear picture of the potential gain and empowers stakeholders to make informed decisions. This kind of data-driven insight is essential for understanding Better Anonymous Website Visitor Data and leveraging it for growth.
Decoding Your Results: Statistics for Non-Statisticians
Understanding the statistical backbone of A/B testing can feel like learning a new language. But fear not! We’re here to explain terms like statistical significance, confidence levels, and p-values. These concepts are crucial for making confident decisions, avoiding false positives (thinking a change worked when it didn’t), and truly understanding the uncertainty inherent in any experiment.
Statistical Significance, Confidence, and P-Values Explained
Let’s break down these often-confusing terms:
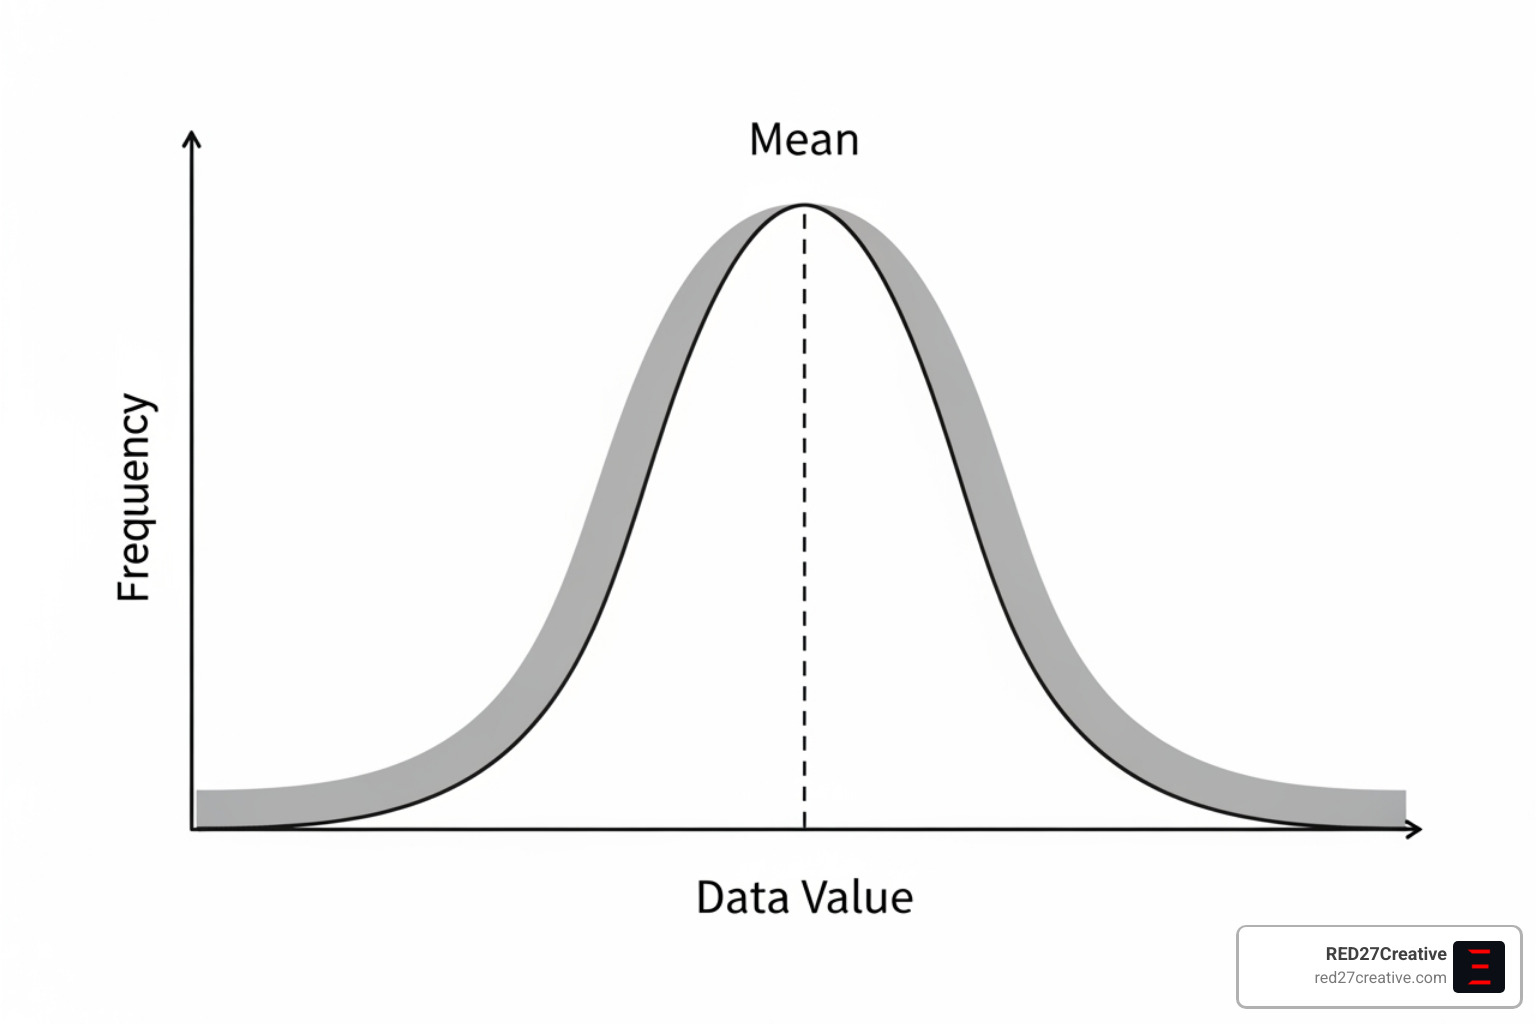
- Statistical Significance: This is our way of determining if the difference we observed between our control (A) and variation (B) is likely “real” or just a fluke of random chance. If a result is statistically significant, it means we’re confident that the change we made caused the difference, rather than it being a random occurrence.
- Confidence Level: This tells us how sure we are about our results. In business and marketing, we typically aim for a 90% to 95% confidence level. A 95% confidence level means that if we were to run the exact same test 100 times, we would expect to get similar results 95 times. It’s our threshold for declaring a “winner.”
- P-value: This is the probability of seeing a result as extreme as, or more extreme than, what we observed, assuming there’s no real difference between A and B. Think of it this way: a low p-value (typically less than 0.05 for 95% confidence) suggests that our observed difference is unlikely to be due to chance. If the p-value is high, it means the observed difference could easily be random, and we can’t confidently say our variation is better.
- Statistical Power: While significance focuses on avoiding false positives, statistical power helps us avoid false negatives. It’s the probability that our test will correctly detect a real effect if one truly exists. We typically set statistical power at 80%. This means we’re willing to accept a 20% chance of missing a real improvement.
These statistical tools are not just for academics; they’re practical safeguards for our marketing investments. To make these calculations easier, we use tools like the Free A/B-test calculator by ABTestGuide.com.
Best Practices for a Reliable A/B Testing Conversion Rate Experiment
Adhering to best practices ensures reliable and actionable results.
- Run Tests for Full Business Cycles: Run tests for at least two full weeks to account for natural fluctuations in user behavior and get an accurate picture of performance.
- Avoid Stopping Tests Early (“Peeking”): Wait until your test reaches its predetermined sample size to avoid false positives. Stopping early, even if one variation is ahead, invalidates results.
- Segment Your Results: Analyze results across different audience segments (e.g., new vs. returning visitors, device type). A variation might be a winner for a specific group, revealing valuable personalization opportunities.
- Account for External Factors: Be aware of holidays, sales, or other campaigns that could skew your data. Isolate your test from this noise to ensure the results are valid. This rigorous approach is a core part of our More info about our SEO Services as well, ensuring we optimize for real user behavior.
Common Mistakes to Avoid and the Broader Benefits of CRO
Even with the best intentions, A/B testing can go awry. Learning from common pitfalls is just as important as understanding best practices. By avoiding these mistakes, we build a more robust culture of experimentation, leading to sustainable long-term growth.
Top A/B Testing Mistakes That Invalidate Your Results
Here are some of the most common A/B testing blunders we help our clients in Geneva, St. Charles, Aurora, and other Illinois locations steer clear of:
- Testing Without a Data-Backed Hypothesis: Randomly changing elements without a clear “why” is a recipe for wasted effort. As we discussed, every test should start with a strong, data-informed hypothesis.
- Not Running the Test Long Enough: Prematurely ending a test based on early results (often called “peeking”) is a classic mistake. It significantly increases the chance of a false positive, leading you to implement a change that doesn’t actually perform better.
- Ignoring Statistical Significance: If your results aren’t statistically significant, you can’t confidently say your variation is better. Implementing a “winning” variation that’s not statistically significant is just gambling.
- Testing Too Many Elements at Once (in an A/B Test): A/B testing is about isolating variables. If you change the headline, image, and CTA color all at once, you won’t know which specific change (or combination) led to the result. This is where multivariate testing might come into play, but it requires much more traffic.
- External Factors Polluting Data: Unexpected events (e.g., a holiday sale, a PR crisis, a major algorithm update) can dramatically influence user behavior during your test. If not accounted for, these can invalidate your results.
- Not Re-testing Winning Variations: The digital landscape constantly evolves. What worked yesterday might not work tomorrow. Re-testing winning variations periodically ensures they continue to perform optimally and helps guard against regression to the mean.
The Benefits of CRO Beyond Increasing Conversion Rates
While increasing your A/B testing conversion rate is the direct goal, the ripple effects of a strong CRO program extend far beyond just that one metric. In fact, 90% of firms rate their CRO program as valuable or extremely valuable for achieving strategic goals.
Here’s how CRO benefits your business in a holistic way:
- Improved Customer Understanding: By constantly testing and analyzing user behavior, we gain deeper insights into what our customers want, need, and respond to. This understanding informs not just our website, but our entire marketing and product strategy.
- Higher ROI from Existing Traffic: You’re already spending money to attract visitors. CRO helps you get more value from that existing investment, turning more visitors into customers without needing to increase your ad spend. This directly contributes to PPC ROI Optimization.
- Improved User Experience (UX): CRO inherently focuses on removing friction points and making the user journey smoother and more intuitive. A better UX leads to happier customers and stronger brand loyalty.
- Increased Customer Lifetime Value (CLTV): By creating a more satisfying and efficient experience, CRO can lead to more repeat purchases, higher average order values, and stronger customer relationships over time.
- Better Informed Marketing Campaigns: The insights gained from A/B tests can be applied across all your marketing channels. Knowing what headlines convert best on your landing page can inform your ad copy, email subject lines, and social media posts.
The average ROI for companies investing in CRO stands at an impressive 223%. This isn’t just about tweaking a button; it’s about building a robust, data-driven engine for continuous business growth.
Frequently Asked Questions about A/B Testing Conversion Rate
What is a good conversion rate for A/B testing?
A “good” conversion rate varies by industry, but a general benchmark is 2-5%. More importantly, focus on achieving a statistically significant lift over your current conversion rate. Even a small, validated improvement of 0.5% can translate to substantial revenue growth over time, making the test a success.
How long should you run an A/B test?
You should run an A/B test long enough to reach a statistically significant sample size, which typically takes a minimum of two weeks. This duration helps account for daily and weekly fluctuations in user behavior. Use a sample size calculator to estimate the required traffic and duration before you start.
What is statistical significance in A/B testing?
Statistical significance tells you whether the observed difference in performance between your control and variation is due to the changes you made or simply random chance. A result is typically considered significant if there’s a 95% or higher probability that the outcome is not a fluke.
Conclusion: Turn Data into Decisions and Drive Real Growth
Mastering your A/B testing conversion rate is less about magic and more about methodical science. It’s a continuous process that starts with solid data, moves through careful hypothesis formation, precise variation creation, and disciplined testing, culminating in rigorous statistical analysis and clear communication. The power lies in incremental improvements; even minor validated gains, consistently applied, build into significant revenue growth over time.
We’ve seen how A/B testing helps us make confident decisions, avoid costly mistakes, and gain invaluable insights into our customers. It’s not just about optimizing a single page; it’s about building a growth engine for your entire business.
At RED27Creative, we build data-driven systems that turn traffic into measurable results. Our team of designers, developers, and SEO experts, serving businesses in Geneva, Batavia, Aurora, St. Charles, Plainfield, Oswego, Naperville, and Chicago, specializes in creating custom websites and implementing strategies that attract visitors, build trust, and convert opportunities into measurable success. We’re ready to help you make confident decisions that fuel real business growth. Don’t leave money on the table; let’s turn your data into your greatest asset.

Kiel Tredrea
https://red27creative.comTop Marketing Agency • Web, SEO & Leads • RED27Creative